Start here
Where are you
on the journey?
Everything on this site is free. This page just puts it in the right order for you.
I'm dreaming of opening a spot
Get the real cost for your concept, the cash you actually need, and the plan a bank will read.
Path twoI already run one
Find out where your money is hiding: the 4-number profitability read and the three numbers to track weekly.
From dream to signed lease, in order.
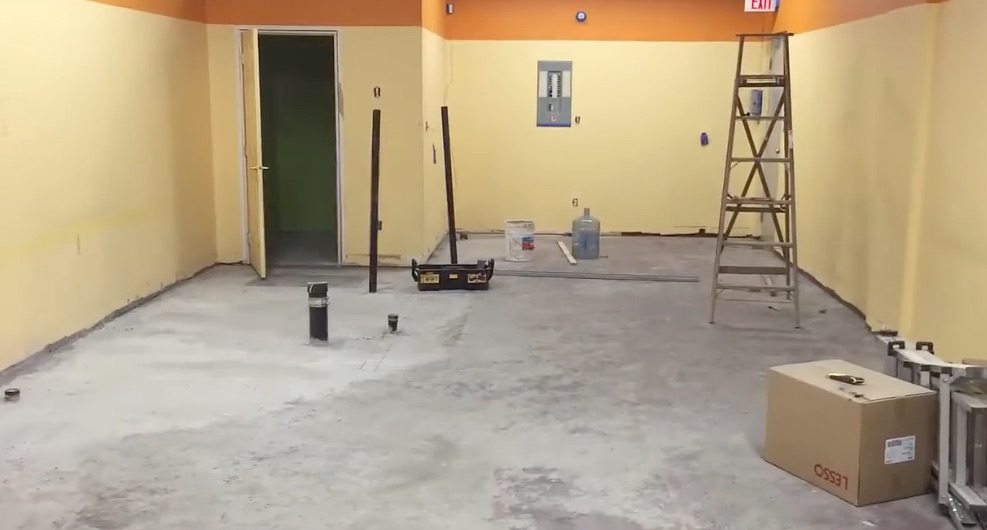
Step 1 — pick your concept. Each complete guide has the real 2026 numbers, line by line:
Food truck
Starting a standard food truck in 2026 costs $155,000 all-in (planning band: $116,500 to $…
Complete guideBakery
Owning a bakery costs $498,000 to open (planning band $373,500 to $622,500), plus a monthl…
Complete guideBar / lounge
Opening a lounge or bar (about 2,800 sq ft in a mid-size US market) costs $946,000 in 2026…
Complete guideBoba / bubble tea
Opening a standard boba shop (roughly 1,000 sq ft, mid-size US market) costs $374,000 in t…
Complete guideCoffee shop
Opening a standard 1,200 sq ft coffee shop in a mid-size US market costs $457,000 all-in, …
Complete guideRestaurant
Opening a standard full-service restaurant (~2,800 sq ft, mid-size US market) costs $969,0…
Complete guideIce cream shop
Opening a standard ice cream shop (~1,100 sq ft, mid-size US market) costs $404,500 in tot…
Complete guideCloud kitchen
Opening a standard cloud kitchen (roughly 400 sq ft in a mid-size US market) costs $208,00…
Step 2 — run your own numbers. The free calculator gives you your cost to open, your ×1.4 cash reserve, and your break-even in about 30 seconds.
Step 3 — get it on paper. The Startup Budget Worksheet and the One-Page Fundable Business Plan turn the numbers into the documents a bank or partner actually wants. Before any lease conversation, read the 7 Lease Clauses Checklist.
Step 4 — go deeper, free. The Profitable Restaurant Owner Academy is the full course, start to finish.
Find out where the money is hiding.
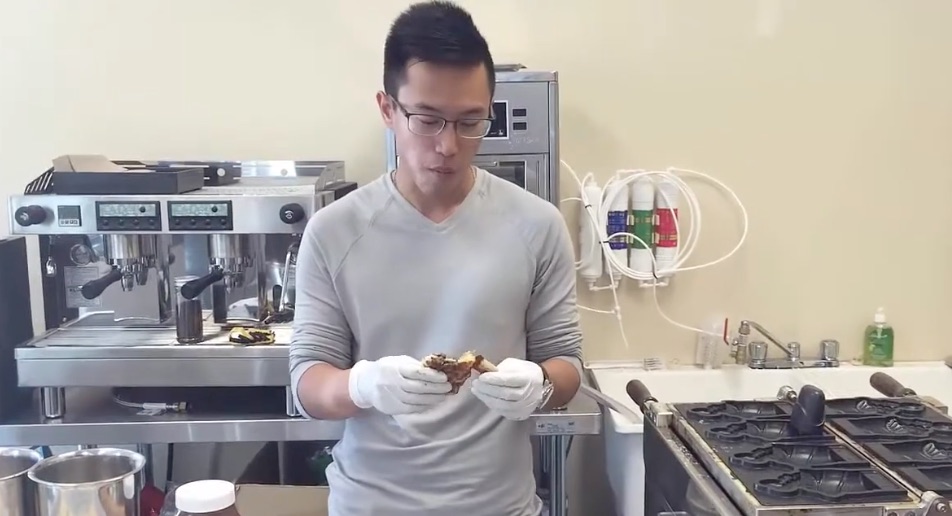
Step 1 — run the free 4-number P&L read: sales, food, labor, rent in; where you're bleeding out.
Step 2 — print the 3 Numbers Scorecard and track AOV, prime cost, and burn weekly. The repeat-customer trend warns you 30 to 60 days before the P&L does.
Step 3 — if you want a second set of eyes on your numbers, here's how working with me goes. And if it's not a fit, the free stuff above will still get you there.
Questions owners actually ask
What is the first step to opening a restaurant or coffee shop?
The first step is getting the real cost for your concept, not writing a menu or scouting locations. Know your all-in opening number, the cash you need within reach, and your daily break-even before you fall in love with a space. The complete guides on this page give you those numbers line by line.
How much money should you save before opening a food business?
Save 1.4 times your total opening cost before you commit to anything. A $374,000 boba shop really needs $523,500 in accessible cash, and a $155,000 food truck really needs $217,000. The buffer is what keeps you alive through build-out overruns and the slow opening months.
How do you know if your restaurant is profitable?
Four numbers tell you: monthly sales, food cost, labor cost, and rent. When food, labor, and overhead each stay near 25% of sales, you keep a real margin; when one runs hot, that is where your money is hiding. The free 4-number P&L read on this page runs the check in minutes.
What numbers should a restaurant owner track every week?
Track three numbers weekly: your average order value, your prime cost (food plus labor against sales), and your burn rate. The repeat-customer trend warns you 30 to 60 days before the P&L does. If you only track one thing, track prime cost against the 25/25/25 target.